STAT 804: Lecture 18 Notes
Forecast standard errors
You should remind yourself that the computations of conditional expectations we have made used the fact that the a's and b's are constants - the true parameter values. In fact we then replace the parameter values with estimates. The quality of our forecasts will be summarized by the forecast standard error:
![]()
We will compute this ignoring the estimation of the parameters and then discuss how much that might have cost us.
If ![]() then
then ![]() so that our forecast standard error is just the variance of
so that our forecast standard error is just the variance of
![]() .
.
Consider first the case of an AR(1) and one step ahead forecasting:
![]()
The variance of this forecast is ![]() so that
the forecast standard error is just
so that
the forecast standard error is just ![]() .
.
For forecasts further ahead in time we have
![]()
and
![]()
Subtracting we see that
![]()
so that we may calculate forecast standard errors recursively.
As ![]() we can check that the forecast variance converges
to
we can check that the forecast variance converges
to
![]()
which is simply the variance of individual Xs. When you forecast a stationary series far into the future the forecast error is just the standard deviation of the series.
Turn now to a general ARMA(p,q). Rewrite the process as the infinite order AR
![]()
to see that again, ignoring the truncation of the infinite sum in the forecast we have
![]()
so that the one step ahead forecast standard error is again
![]() .
.
Parallel to the AR(1) argument we see that
The errors on the right hand side are not independent of one another so that
computation of the variance requires either computation of the covariances or
recognition of the fact that the right hand side is a linear combination of
![]() .
.
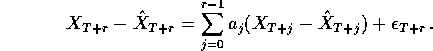
A simpler approach is to write the process as an infinite order MA:
![]()
for suitable coefficients ![]() . Now if we treat conditioning on the data
as being effectively equivalent to conditioning on all
. Now if we treat conditioning on the data
as being effectively equivalent to conditioning on all ![]() for t ;SPMlt; T we
are effectively conditioning on
for t ;SPMlt; T we
are effectively conditioning on ![]() for all t;SPMlt;T. This means that
for all t;SPMlt;T. This means that

and the forecast error is just
![]()
so that the forecast standard error is
Again as ![]() this converges to
this converges to ![]() .
.
Finally consider forecasting the ARIMA(p,d,q) process
![]() where W is ARMA(p,q).
The forecast errors in X can clearly be written as a linear combination of
forecast errors for W permitting the forecast error in X to be written as
a linear combination of the underlying errors
where W is ARMA(p,q).
The forecast errors in X can clearly be written as a linear combination of
forecast errors for W permitting the forecast error in X to be written as
a linear combination of the underlying errors ![]() . As an example consider
first the ARIMA(0,1,0) process
. As an example consider
first the ARIMA(0,1,0) process ![]() . The forecast of
. The forecast of
![]() is just 0 and so the forcast of
is just 0 and so the forcast of ![]() is just
is just
![]()
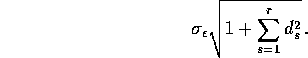
The forecast error is
![]()
whose standard deviation is ![]() . Notice that the forecast standard
error grows to infinity as
. Notice that the forecast standard
error grows to infinity as ![]() . For a general ARIMA(p,1,q)
we have
. For a general ARIMA(p,1,q)
we have
![]()
and
![]()
which can be combined with the expression above for the forecast error for an ARMA(p,q) to compute standard errors.
Software
The S-Plus function arima.forecast can do the forecasting.
Comments
I have ignored the effects of parameter estimation throughout. In ordinary least squares when we predict the Y corresponding to a new x we get a forecast standard error of
![]()
which is
![]()
The procedure used here corresponds to ignoring the term ![]() which is
the variance of the fitted value. Typically this value is rather smaller than the 1 to
which it is added. In a 1 sample problem for instance it is simply 1/n. Generally
the major component of forecast error is the standard error of the noise and the
effect of parameter estimation is unimportant.
which is
the variance of the fitted value. Typically this value is rather smaller than the 1 to
which it is added. In a 1 sample problem for instance it is simply 1/n. Generally
the major component of forecast error is the standard error of the noise and the
effect of parameter estimation is unimportant.
In regression we sometimes compute perdiction intervals
![]()
The multiplier c is adjusted to make the coverage probability
![]() close to a desired coverage
probability such as 0.95. If the errors are normal then we can get
c by taking
close to a desired coverage
probability such as 0.95. If the errors are normal then we can get
c by taking ![]() . When the
errors are not normal, however, the error in
. When the
errors are not normal, however, the error in ![]() is dominated by
is dominated by
![]() which is not normal so that the coverage probability can
be radically different from the nominal. Moreover, there is no particular
theoretical justification for the use of t critical points. However, even
for non-normal errors the prediction standard error is a useful summary of
the accuracy of a prediction.
which is not normal so that the coverage probability can
be radically different from the nominal. Moreover, there is no particular
theoretical justification for the use of t critical points. However, even
for non-normal errors the prediction standard error is a useful summary of
the accuracy of a prediction.